Line Chart
June 13, 2022
1 min
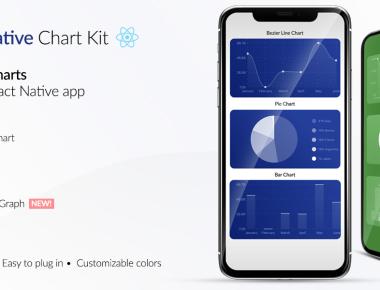
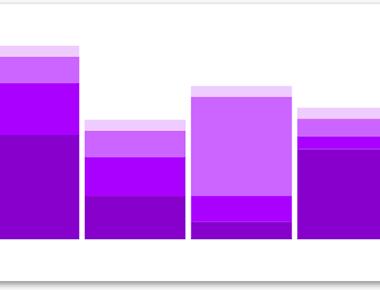
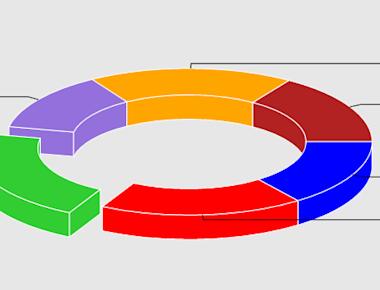
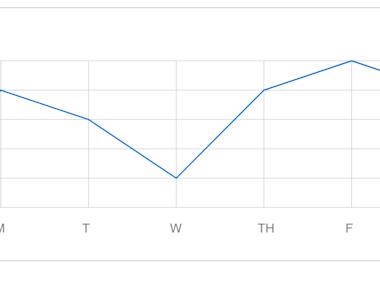
React-native-chart is a simple module for adding line charts, area charts, or bar charts to your React Native app.
https://snack.expo.dev/@sam042/awesome-react-native---bar-chart
npm i react-native-chart-kit --save
import React from 'react';
import {
  SafeAreaView,
  Text,
  View,
  StyleSheet,
  Dimensions,
  ScrollView,
} from 'react-native';
import { BarChart } from 'react-native-chart-kit';

const MyBarChart = () => {
  return (
    <>
      <Text style={styles.header}>Bar Chart</Text>
      <BarChart
        data={{
          labels: ['January', 'February', 'March', 'April', 'May', 'June'],
          datasets: [
            {
              data: [20, 45, 28, 80, 99, 43],
            },
          ],
        }}
        width={Dimensions.get('window').width - 16}
        height={220}
        yAxisLabel={'Rs'}
        chartConfig={{
          backgroundColor: '#1cc910',
          backgroundGradientFrom: '#eff3ff',
          backgroundGradientTo: '#efefef',
          decimalPlaces: 2,
          color: (opacity = 1) => `rgba(0, 0, 0, ${opacity})`,
          style: {
            borderRadius: 16,
          },
        }}
        style={{
          marginVertical: 8,
          borderRadius: 16,
        }}
      />
    </>
  );
};

const App = () => {
  return (
    <SafeAreaView style={{flex: 1}}>
      <ScrollView>
        <View style={styles.container}>
          <View>
                  <MyBarChart />
          </View>
        </View>
      </ScrollView>
    </SafeAreaView>
  );
};

export default App;

const styles = StyleSheet.create({
  container: {
    flex: 1,
    backgroundColor: 'white',
    justifyContent: 'center',
    alignItems: 'center',
    textAlign: 'center',
    padding: 10,
  },
  header: {
    textAlign: 'center',
    fontSize: 18,
    padding: 16,
    marginTop: 16,
  },
});
Quick Links
Legal Stuff
