React Native charting libraries
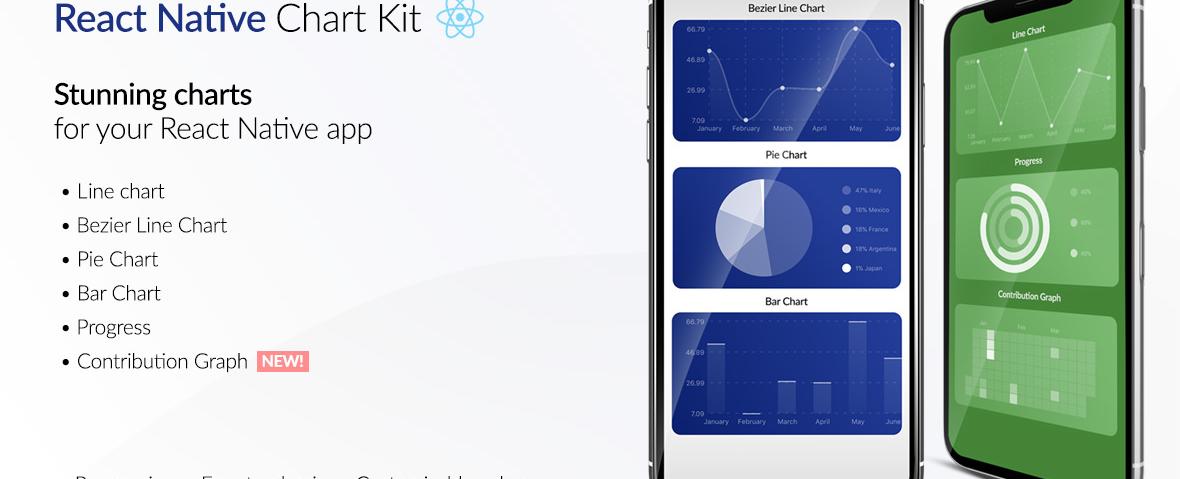
Table Of Contents
Using Charts in React Native
Charts are an essential tool for displaying data in a visually appealing and understandable way. In React Native, there are several libraries that allow developers to integrate charts into their applications with ease. In this article, we will explore three of the most popular charting libraries for React Native and provide step-by-step instructions on how to use them.
React Native Chart Kit
React Native Chart Kit is a popular library for creating charts in React Native applications. It offers a range of chart types, including line, bar, pie, and progress, as well as customizable colors and animations. Here are the steps required to use React Native Chart Kit in your application: Installation
To install React Native Chart Kit, run the following command:
npm install react-native-chart-kit
Usage
After installing React Native Chart Kit, you can import the chart type you want to use and render it in your component. Here’s an example of how to render a line chart:
import { LineChart } from 'react-native-chart-kit';const data = {labels: ['January', 'February', 'March', 'April', 'May', 'June'],datasets: [{data: [20, 45, 28, 80, 99, 43],},],};const chartConfig = {backgroundGradientFrom: '#1E2923',backgroundGradientTo: '#08130D',color: (opacity = 1) => `rgba(26, 255, 146, ${opacity})`,};<LineChart data={data} width={screenWidth} height={220} chartConfig={chartConfig} />
This code renders a line chart with sample data and a custom color configuration.
Victory Native
Victory Native is another popular charting library for React Native. It offers a wide range of chart types, including area, bar, line, and pie charts, and supports complex data visualizations. Here’s how to use Victory Native in your application: Installation
To install Victory Native, run the following command:
npm install victory-native
Usage
After installing Victory Native, you can import the chart type you want to use and render it in your component. Here’s an example of how to render a bar chart:
import { VictoryBar } from 'victory-native';const data = [{ quarter: 1, earnings: 13000 },{ quarter: 2, earnings: 16500 },{ quarter: 3, earnings: 14250 },{ quarter: 4, earnings: 19000 },];<VictoryBar data={data} x="quarter" y="earnings" />
This code renders a bar chart with sample data.
React Native SVG Charts
React Native SVG Charts is a lightweight library for creating simple charts in React Native applications. It supports line, bar, and pie charts and allows for easy customization. Here’s how to use React Native SVG Charts in your application: Installation
To install React Native SVG Charts, run the following command:
npm install react-native-svg-charts
Usage
After installing React Native SVG Charts, you can import the chart type you want to use and render it in your component. Here’s an example of how to render a line chart:
import { LineChart } from 'react-native-svg-charts';const data = [50, 10, 40, 95, 85, 91, 35, 53, 75];<LineChart style={{ height: 200 }} data={data} />
This code renders a line chart with sample data.
Comparison
| Feature | React Native Chart Kit | Victory Native | React Native SVG Charts |
|---|---|---|---|
| Chart types | Line, bar, pie, progress | Area, bar, line, pie | Line, bar, pie |
| Customizable colors | Yes | Yes | Yes |
| Customizable animations | Yes | Yes | No |
| Complex data visualizations | No | Yes | No |
| Lightweight | No | No | Yes |
| Installation | npm install react-native-chart-kit | npm install victory-native | npm install react-native-svg-charts |
Best tools
Charts are a powerful tool for displaying data in a visual and understandable way. In React Native, there are several libraries that make it easy to integrate charts into your applications. We saw React Native Chart Kit, Victory Native, and React Native SVG Charts. By following the step-by-step instructions provided for each library, you can easily add charts to your React Native applications and create stunning visualizations that will enhance your users’ experience.
Share
Related Posts

Quick Links
Legal Stuff

